Goals:
Determine if :
- answers are entered faster
- accuracy is improved
Analysis:
Case Study of Student A:
Student A information:
- Used the Math Facts program for the fall of 2009.
- This student is a good candidate for extra assistance.
- 204 attempts made.
- 184 attempts with a score greater than 70% (note that for the smaller tables 100% is required to get above 70%)
- 2131 questions answered of attempts with final score greater than 70%.
- 3.73 second average question response time.
- 3-5 grade level.
The problems that student A struggles with can be seen in the table below.
| Question Asked | # Incorrect | # Correct | # Answered | % Incorrect |
| 3+4 | 4 | 42 | 46 | 08.70% |
| 4x2 | 4 | 26 | 30 | 13.33% |
| 5x2 | 2 | 12 | 14 | 14.29% |
| 4x3 | 3 | 17 | 20 | 15.00% |
| 3x3 | 6 | 26 | 32 | 18.75% |
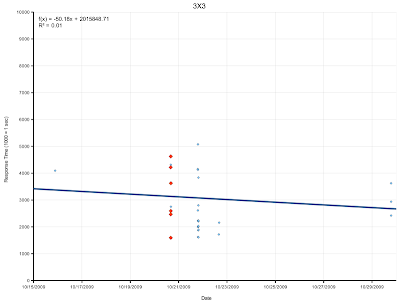
The graph below shows the students response time for the question 3x3. Again one outlier has been included in the calculations but removed from the graph to make the graph more readable. The red marks indicate incorrect responses.
Similar to the previous graph the student shows an overall progress towards more faster and accurate responses.
Case Study of Student B:
Student B information:
- Used the Math Facts program during the spring and fall of 2009.
- Average student
- 459 attempts made.
- 450 attempts with a score greater than 70% (note that for the smaller tables 100% is required to get above 70%)
- 20233 questions answered of attempts with final score greater than 70%.
- 1.47 second average question response time.
- 6-8 grade level.
| Question asked | # Incorrect | # Correct | Total Answered | % Incorrect |
| 4+12 | 2 | 9 | 11 | 18.18% |
| 9+7 | 9 | 40 | 49 | 18.37% |
| 8+3 | 16 | 60 | 76 | 21.05% |
| 3+8 | 17 | 53 | 70 | 24.29% |
| 7+9 | 12 | 36 | 48 | 25.00% |
| 8+9 | 11 | 30 | 41 | 26.83% |
| 9+8 | 14 | 30 | 44 | 31.82% |
| 4X12 | 4 | 8 | 12 | 33.33% |
| 3X12 | 7 | 6 | 13 | 53.85% |
| 5X12 | 8 | 3 | 11 | 72.73% |
Below is the graph of this students average question response time. Each marker indicates the average response time for that one attempt. Two outliers at about 3.6 and 4 were removed from the graph but not the trendline.
From the table above it appears that this student stuggles with 8+9. The graph below indicates this students response times to the question 8+9. The gap between the two sets of data is summer break.
As you can also see from the graph the number off incorrect responses has also decreased.
Conclusion:
As you can see from analyzing these students overall and specific question responses they were able to improve Math Fact abilities with the use of my Math Facts program.
Advantages of this Math Facts program:
- Students get immediate visual feedback of whether they got the problem correct or incorrect without it being distracting.
- Automated grading
- Record of all information allowing detail analysis.
- Visual stimulation of student to do better and complete as many of their multiplication tables as possible.


No comments:
Post a Comment