Tuesday, December 29, 2009

How to Solve Absolute Value Inequalities

Objective:
  • Find the solution of a single variable inequality equation.
Assumptions:
  • The at you know how find the value of an inequality equation with a single variable.
Concepts:
  • Write the problem as two variations to remove the absolute value.
  • Solve as normal.
Directions:
Since absolute values can contain either a positive or negative number that is always evaluated to a positive number. We need to write the equation twice since we don't know if it is positive or negative. Let's use the example:
| 9 + x | < 7

| 9 + x | < 7
(9 + x ) < 7
9 - 9 + x > 7 - 9
x > -2
-(9 + x ) < 7
-(9 + x )/-1 < 7/-1
(9 + x ) > -7
9 + x > -7
9 - 9 + x > -7 - 9
x > -16
x < -2 and x > -16
-16 < x > -2

Many text books have students memorize the fact that you change the inequality sign and make the right side negative and positive but I have found that the method shown here helps students to make fewer mistakes.

Things to remember when solving absolute value inequalities.

  • Isolate the absolute value to one side of the equation first.
  • Remember to change the inequality sign when multiplying or dividing by a negative number.
  • Less than (<) are usually and statements.
  • Greater than (>) are usually or statements.
  • Watch out for the exceptions such as |x| < 0 or any other value less than 0, since absolute values always evaluate to be positive it will never be less than 0.
  • Watch out for the exception |x| > -1 which is all values of x. Again since the absolute value always evaluates to be positive any number that you insert will always work.
  • And statements may be written two different ways whereas or statements may only be written one way.

Monday, December 28, 2009

How to Create Box-and-whisker Graph

Are your students struggling with creating box and whisker graphs? Here are some directions and presentations that can help students quickly learn how to put the right numbers in the right place. The first version is only in PDF and the second contains the first and is fully customizable, or you can just read through the steps listed below.
The OpenOffice/PowerPoint versions contain simple animations and timings to help the presentation flow smoothly but the PDF version can work if you don't have access to OpenOffice or MS PowerPoint.

Vocabulary
Median
The middle value when all of the data values are placed in order.

Quartile
One forth or one quarter of the data.

Extreme
Value that is far from the rest of the data.
The largest and smallest value.

Example Problem
The owner of a gas station wants you to make a box-and-whisker graph to represent the number of people who came purchased gas each day.

Data
17 21 16 22 24 26 18 28 25 29 21 18 14 23 25 18 26 24 22 23

Follow these steps:
  1. Order the data
  2. Find extremes
  3. Find the median
  4. Find the quartiles
  5. Make your graph
Step 1: Order the data
A line plot or stem-and-leaf plot are the quickest ways to get your data in ascending order.
14 16 17 18 18 18 21 21 22 22 23 23 24 24 25 25 26 26 28 29

Step 2: Find the extremes
The lower extreme is 14, the smallest number.
The upper extreme is 29, the largest number.

Step 3: Find the median
Count the number of data items, which in this set happens to be 20.
Then divide the data into two equal parts, 10 on each side.
14 16 17 18 18 18 21 21 22 22
23 23 24 24 25 25 26 26 28 29


Since there is no middle value we need to take the average of one value from each side, 22 and 23. To find the average evaluate the following expression:

(22+23)÷2=22.5

The median is 22.5.

Step 4: Find the quartiles
Now divide each of the halves in half. Since each half contains 10 (even) items the middle is between the 5th and 6th value.


Data:
14 16 17 18 18
18 21 21 22 22
23 23 24 24 25
25 26 26 28 29


Take the average of the two values.
(18+18)÷2=18
(25+25)÷2=25

The lower quartile is 18.
The upper quartile is 25.

Step 5: Use the information to make your graph.

Tuesday, December 22, 2009

Math Facts Effectiveness Study

Students have been using Math Facts for almost a year now and enough information has been collected to determine its effectiveness. Here I will share the data from an couple of anonymous student that has been faithfully using the Math Facts program.

Goals:
Determine if :
  • answers are entered faster
  • accuracy is improved
These goals are based off of a previous Math Facts study that indicated that faster times and better Algebra I scores go together not just better accuracy.

Analysis:
Case Study of Student A:
Student A information:
  • Used the Math Facts program for the fall of 2009.
  • This student is a good candidate for extra assistance.
  • 204 attempts made.
  • 184 attempts with a score greater than 70% (note that for the smaller tables 100% is required to get above 70%)
  • 2131 questions answered of attempts with final score greater than 70%.
  • 3.73 second average question response time.
  • 3-5 grade level.
The graph below shows the students average question response time. Each mark on the graph indicates the average response time that it took to respond to each question in a given attempt. Two outliers have been removed from the graph but are still included in the trendline and trendline equation in the graph below. Their values were 14.9 seconds on 9/2/09 and21.1 seconds on 10/21/09. These values probably have more to do with the students ability to focus on the activity at hand than the ability to do the problems.


The problems that student A struggles with can be seen in the table below.

Question
Asked
#
Incorrect
#
Correct
#
Answered
%
Incorrect
3+4 4 42 46 08.70%
4x2 4 26 30 13.33%
5x2 2 12 14 14.29%
4x3 3 17 20 15.00%
3x3 6 26 32 18.75%

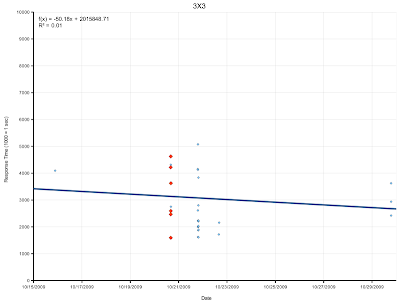
The graph below shows the students response time for the question 3x3. Again one outlier has been included in the calculations but removed from the graph to make the graph more readable. The red marks indicate incorrect responses.

Similar to the previous graph the student shows an overall progress towards more faster and accurate responses.

Case Study of Student B:
Student B information:
  • Used the Math Facts program during the spring and fall of 2009.
  • Average student
  • 459 attempts made.
  • 450 attempts with a score greater than 70% (note that for the smaller tables 100% is required to get above 70%)
  • 20233 questions answered of attempts with final score greater than 70%.
  • 1.47 second average question response time.
  • 6-8 grade level.
The table below shows the problems that this student finds most difficult.


Question
asked
#
Incorrect
#
Correct
Total
Answered
%
Incorrect
4+12 2 9 11 18.18%
9+7 9 40 49 18.37%
8+3 16 60 76 21.05%
3+8 17 53 70 24.29%
7+9 12 36 48 25.00%
8+9 11 30 41 26.83%
9+8 14 30 44 31.82%
4X12 4 8 12 33.33%
3X12 7 6 13 53.85%
5X12 8 3 11 72.73%
A couple of interesting points here are that the accuracy of 3+8 and 8+3 are similar but 9+7 and 7+8 has a difference of 6.63%.

Below is the graph of this students average question response time. Each marker indicates the average response time for that one attempt. Two outliers at about 3.6 and 4 were removed from the graph but not the trendline.

From the table above it appears that this student stuggles with 8+9. The graph below indicates this students response times to the question 8+9. The gap between the two sets of data is summer break.

As you can also see from the graph the number off incorrect responses has also decreased.

Conclusion:
As you can see from analyzing these students overall and specific question responses they were able to improve Math Fact abilities with the use of my Math Facts program.

Advantages of this Math Facts program:
  • Students get immediate visual feedback of whether they got the problem correct or incorrect without it being distracting.
  • Automated grading
  • Record of all information allowing detail analysis.
  • Visual stimulation of student to do better and complete as many of their multiplication tables as possible.

Monday, December 14, 2009

Blended Learning Presentation

As I was browsing the web in search of lesson plans for Scribus I discovered the following presentation at the edubuntu.org Lessons wiki, by JimHutchinson. I thought it was very well done. Thanks for sharing Jim.

Sunday, December 6, 2009

New Random Student Selector

I created a new Random Student Selector that is based on Flash instead of server scripting. This should allow the random selections to work faster and reduce the load on my server, providing you with better service. The program works using the same logic as the server scripted version with the added benefit that if a student comes in late you can add their name to the list. They will be entered into the list of selectable names as though they had just answer the last question before they entered the classroom.

It appears that the server scripted version has been very popular. Since I don't particularly care to have advertising when I am using a web page in my classroom I'm going to try an experiment and see if people will donate to keep the ad's off this page.

Thursday, December 3, 2009

Classroom in a Blog: A Quick Introduction to Inkscape

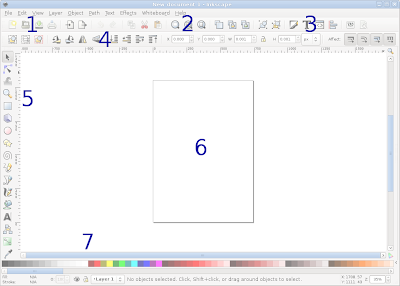
In the image below I've outlined the sections of tools that you need to know to help you get up and running with Inkscape.

The numbered list below high lights each of the numbered tools in the image above.
  1. New Document, Opening, Printing & Importing

    Tools from left to right: New, Open, Save/Save As, Print, Import, and Export
    Inkscape has the ability to open and save a wide variety of file types: svg, PDF, Adobe Illustrator (ai), and more.
    Inkscape can also send files directly to the printer.
    Inkscape can import even more file types that it can open.
    Inkscape can only export one file type - portable network graphic (png).

  2. Zoom tools

    Tools from left to right: Zoom to selection, zoom to all objects, and zoom to page.
    • The first tool allows you to zoom so that what you currently have selected fills the screen.
    • The second tool zooms so that you can see everything that has been drawn. This can be handy if you are trying to find a missing object.
    • The last tool zooms so that your page fills the page.

  3. Useful dialogs

    Dialogs from left to right: Stroke/fill, text, XML, and alignment.

  4. Quick transformations and in-layer ordering

    Tools from left to right: Rotate 90 counter clockwise, 90 clockwise, mirror along the vertical axis, mirror horizontal, move to back, move back, move up, and move to front.

  5. Drawing tools
    • Select & Transform
      Use to move objects around and change their size and rotation. You can also do a few distortions such as skewing.
    • Edit Path
      This tool allows you to readjust key points within an object called nodes.
    • Tweak
      Manipulate objects by pushing them around.
    • Magnifying glass
      Use this tool if the keyboard shortcuts for zooming in and out aren't enough.
    • Square/Rectangle
    • 3D Box
    • Circle/Ellipse
    • Star/Polygon
    • Spiral
    • Freehand
    • Bezier curve & straight line tool
      Bezier curves are based on points and how they affect a line. The line drawn does not necessarily pass though the point that controls what a bezier curve line looks like.
    • Calligraphy
    • Fill
    • Text
    • Diagram Connect
    • Gradient edit
    • Eye Dropper

  6. Drawing area
    The drawing area is all of the white space in the center of the screen referred to as the canvas. The box in the center is a page on the canvas. Because Inkscape is a drawing program not a desktop publishing program such as Scribus, Quark, Adobe InDesign, or MS Publisher, you only get one page to work on.

  7. Color palette

    There are two main things to think about with the color palette the fill and stroke. The fill as the name implies is the color inside of an object and the stroke is the outline color. In the image above you can see that with the current tool that is selected I don't have a fill or stroke color selected because N/A appears instead of a color.
Coming Next
A lesson that will briefly introduce you to the majority of the tools shown here.

Wednesday, December 2, 2009

Classroom in a Blog: Inkscape

This blog series will help introduce you to the open source vector base drawing program Inkscape. The title obviously is a spin-off from the well known series by Adobe Systems.

Note: This series is based on Inkscape version 0.46 and newer. Since Inkscape has not yet matured to version 1.0 we will focus only the features that are considered stable. My focus is to have lessons that can be used in the classroom without having to install extras and work around solutions or cause the program to crash.

Here is a rough table of contents for what this series will contain. I will come back and update this with links as I progress.
  1. Quick Start
  2. Creating and Editing Shapes
  3. Selecting & Aligning
  4. Transforming Objects
  5. Drawing Tools
  6. Color and Painting
  7. Working with Type
  8. Working with Layers
  9. XML
  10. Combining Inkscape with other Applications
  11. SVG
Other Reading:
Book/Website: Inkscape: Guide to a Vector Drawing Program

Wednesday, November 18, 2009

FreeMind in the Classroom

Over the past few days, in my classroom, we have been discussing different ways in which to study information. I introduced my students to concept mapping or mind-mapping.

I had been introduced to Inspiration, by Inspiration Software, a few years ago. I thought it was a pretty interesting program but I did not spend any time using it. I felt that I knew the features of the program, though I did not understand the potential of how it could change the classroom. Later, I came across an Open Source version called FreeMind which can be downloaded from sourceforge.net. My students and I watched a video on mind-mapping the other day and so I installed this software on all of the computers in the lab. Today the students were introduced to the software and asked to make a map or multiple maps of the three sections from their science chapter that we just finished. They picked up the program pretty quickly after showing them only a few features in the program.

I demonstrated the following features to them in the classroom and then let them loose.
  • Insert key: add a new child not or branch connected to the parent.
  • Shift-enter: add a sibling node or branch that is connected to the same node as as the node selected.
  • Changing the text in a node
  • Right click to access properties such as style and formating.
In my research to relocate this program I did find another program that has some potential called XMind. Both programs are platform independent (Java), open source, and free. I believe each of them have their different strengths and weaknesses. I will be introducing my students to XMind at another point in time at which I will write a quick review about how well it worked.

Sunday, October 18, 2009

State Capital Questions for Moodle

In class we have been reviewing the state capitals of the United States of America. We have been using Moodle matching and short answer questions to help learn them. If you would like to use the questions in your Moodle system you can download them at lulu.com "State Capitals of the United States of America"

I've saved the files in the Moodle XML format all you need to do is import them into your question bank and you will have all of the state capitals as short answer questions. To help the students learn the capitals at first you can create a Random Short-Answer matching question type. Here's a screen shot of what they look like.

Tuesday, October 6, 2009

Mathfacts Update

Beta Version Update:
The default page after logging in has been updated so that students can more intuitively select which numbers are going to practice. The new format gives the students quick visual feedback about which problems they have and have not worked on and how fast they have solved them.

Statistics:
  • Over 100 users
  • 4,482 Math Fact tables completed
  • Over 160,000 questions answered
  • The fastest time for solving the 10 by 10 multiplication table with 100% accuracy is 2 minutes and 11.532 seconds.
  • The fastest time for solving the 10 by 10 addition table with 100% accuracy is 2 minutes and 30.687 seconds.
Observations:
  • This makes and interesting trend that I have seen in my classes but is also true across the different schools that are participating. Students addition speeds are slower than there multiplication speeds.
  • When students practice just a few times per day it helps there speed and accuracy more than a bunch of practices once per week.
  • The new table visual mentioned above allows students that are below level be successful and make progress.
If you are interesting in locking in at the current pricing forever you need to sign up quickly because there are only 5 beta accounts are still available. Keep in mind that beta doesn't mean unstable because I use this every day in my classroom.

Friday, March 13, 2009

Math Facts is up and running

It's finally here an online Math Facts program that gives you the information you need to improve your math scores. All you need to do is fill out the survey I recently posted and I'll get an account created for you. I just recently added a few features that I haven't seen in any other online math facts programs.
  • The ability for a student to practice on the problems that they get wrong the most.
  • The ability for a student to practice on the problems that they have to think about the longest.
The program is currently still being beta tested but is fully functional. I am currently accepting a few more beta tester accounts. Personal tester accounts are free, that is without any students. Home school and classroom beta accounts have a minimal setup fee that covers up through the first year of non-beta service and locks in future service at that price.

You can check out a screenshot of what the new version looks like on the help page.

Monday, March 2, 2009

Examples of How to Use Technology to Enhance Learning

Our view of technology is continually changing along with what it can provide the educational community. Initially many pieces of technology are now used as door stops but a few have them have shown themselves to have real educational value. Since Computer Science is my area of expertise I've always been interested in different ways to integrating technology into my classroom. I quickly recognized that many of the things out there can be categorized as either door stops or baby sitters. As we integrate techniques of using technology into the classroom we need to always ask, "Does this add value to what I am doing?" Notice that I said techniques and not technology. Simply the presence of technology doesn't mean that it will improve the educational environment. Here is a list of some of how I use technology to improve my students learning experience.

Google Docs:
Online word processor:
Google docs can be used to help students with the peer editing process. You can even publish articles to the web using it. Google Docs word processor is very suitable for many collaborative projects since multiple people can access the same document and you can see the revisions or changes that each have made over time. Much like a wiki but much easier to use. When you have finished editing the content it can then be published to the web or export to a PDF, or word document.

Google Forms:
I've used Google Forms to collect material orders from students for a Bridge Building contest. I'm sure that it could be used for many other things but I haven't done that yet.

Google Spreadsheet:
We've shared our the results from growing plants with an AeroGarden. It is published as a web page so you can see the latest information. Each of the students have rights to edit the content in the document.

Blogger:
I use blogger.com to post a list of the assignments for each day. Since I'm teaching 5-8 homeroom and three 9-10 subjects I've found it most effective to create 2 blog posts per day, one for each of the classes. All of the assignments are also listed on my Moodle server in my classroom which is available to students when they are at home.

PicasaWeb:
PicasaWeb is an easy way to share photos with students for class projects. This program works on the Linux, Windows, and Mac OS.

Math Facts:
Flash based website which records and grades students mathfacts scores. This program shows detailed reports about the students responses and can be exported to any other program to analyze it.

Moodle:
Post assignment information, due dates, forums, and interactive assignments.

Wacom Tablet:
I've used this while lecturing and for creating screen casts. The tablet that I have is the Bluetooth version so that I don't have to be tethered to the computer.

ScreenCasts:
I've made videos of how to do specific math lessons so that students can watch the video in class on a portable DVD player or they can access the same video clips online. You could even sync these videos to a mobile video player, but I haven't done this since my students don't have them. See also Presentation Software.

Quizdom Remote:
Useful for reviewing information and checking to make sure that students are engaged and understanding the material being presented. Initially I used this for graded activities but moved away from that because of how the students. Interacted with the material. I found it most effective to have a few short questions during and after a presentation to make sure that they stayed tuned in and understood the material. I also found it to be effective in help the student review material. Reviews were usually in a format similar to Jeopardy. Unfortunately I am currently not using these since don't have them at my new job.

Projector:
You can think as the projector as the 21st century black board or white board depending on what generation you are from. A projector in the classroom allows a teacher to present videos, demonstrations, and interact with the students at a whole new level. I find it interesting when talking with a teacher about a smart board really all they need is a projector. If you are only wanting to display what you see on your screen to the board then this is all you need. If you want the students or yourself to be able to interact with the projected screen then you need a smart board type of technology.

Presentation Software: PowerPoint is what comes to most peoples mind when they think about presentation software. There are actually several different options out there today. There is OpenOffice Impress which works on Windows, Mac, and Linux. I understand that KeyNote is a powerful pieces of software for the Mac but I don't have any experience with it.

Conclusion:
I've rambled on long enough I'm sure that you can see that technology has significantly changed how we teach and the options we have available. I would love to hear some of the stories of how you have effectively used technology in your classroom. How has it improved your students learning experience? Students are also welcome to share their experiences.

Sunday, February 22, 2009

Math Facts

The Math Facts service at Aschool.us is ready for beta testing.

If you are interested in participating you can sign up by filling out the simple classroom survey below. The first 20 accounts will receive a free 1 year account. All other survey's will be kept and you will be notified when we come out of beta testing or when more accounts are made available.

Why is ASchool.us's MathFacts different from the others? Information is what empowers people to make changes. ASchool.us's Math Facts program is designed to empower the teacher and student by helping them determine which areas of their math facts are weak. ASchool.us's teacher reports help summarize what is happening and provide the details so that the teacher can make their own observations.

Friday, February 20, 2009

Science Fair Projects website

If you are looking for ideas for science projects check out Science Fair Central at Discovery Education. There is a great list of different project ideas with questions to ask and ideas of what data to collect for the projects. Their are also many different tips on how to make your science project a success.